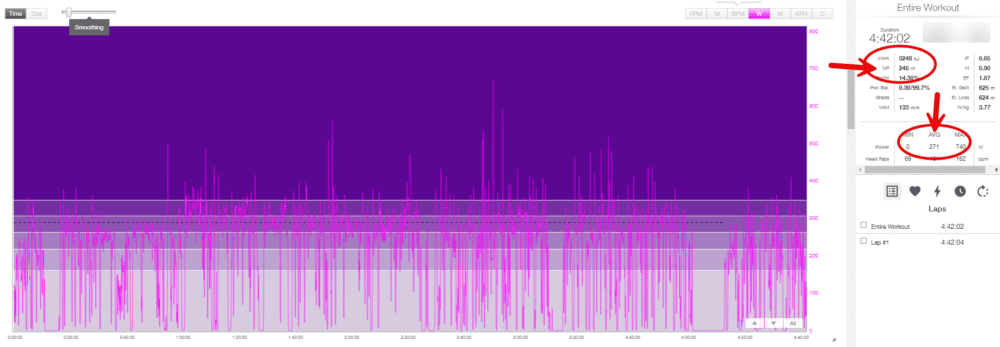
This is a technical question that can help build your understanding of common cycling metrics and catch common mistakes in setting up bike computers and analyzing data. Occasionally a cyclist will notice that their Normalized Power (A smoothed rolling 30-second average) is LOWER than their average power (AP).
Two reasons your NP is lower than your Average Power (AP).
Normalized Power (NP) uses a rolling average to smooth out power spikes and was intended to estimate the physiological stress caused by high-intensity efforts by estimating the equivalent steady state ride. Normalized Power is used in the formula that calculates TSS (Training Stress Score) to try and better estimate the ‘training stress’ associated with the ride, relative to your Functional Threshold Power (FTP).
Variability Index (NP/AVG Power) is a simple and useful metric that reflects how steady a ride is by dividing the Normalized Power by the Average Power. For longer steady efforts on ERG MODE or during a steady zone 2 endurance ride it would be expected that NP would be similar to the average power (a low Variability Index such as 1.0 – 1.05). For variable efforts like intervals or mountain biking you would see a higher Variability Index, meaning Normalized Power is higher than Average Power.
It would not be normal to see a VI less than 1.0, which would mean that Normalized Power is LESS than Average Power. This typically means one of two things are off in your data collection or in your data analysis.

Normalized Power isn’t for Short Efforts
Normalized Power (NP) isn’t used for efforts shorter than 20 minutes (link). As efforts get shorter you run into issues where the 30-second rolling ‘windows’ that are being averaged won’t be long enough to have representative data. So if you are noticing the lower NP on a short effort the solution is to disregard NP for short efforts and stay focused on AVERAGE POWER (AP) or your speed on the segment!
As an example, on a set of 5 x 3 minute Mountain Bike Intervals you could look at the distance covered (e.g. did you get to the top of the hill in 3 minutes) and you could see what the average power was or look at peaks for 30 seconds or other durations. For this same workout you COULD look at Normalized power for the whole set of intervals or the whole ride and compare that week over week. (e.g. Normalized power for 5 x 3 min on / 3 min off, which is 30 minutes of total time).
![]()


![]()
![]()
![]()
Record those Zeros!
A very common reason that data gets messed up, especially if you use training peaks, is that they have their bike computer set to “EXCLUDE ZEROS” for power and cadence but you actually want to INCLUDE ZEROS. If you take out the zeros then you will inflate the average power and possibly see a lower normalized power, since NP will still use the zeros. If your workouts typically involve consistent pedaling with minimal coasting or if you focus on structured intervals with little downtime, excluding zeros may not significantly impact NP calculations but it is common opinion that INCLUDING zeros is the best practice. We have a post about setting up your bike computer here for help changing the setting.
Still have Questions? Consider a phone consultation to discuss your data! LINK TO BOOK


